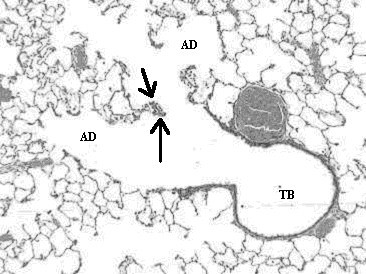
Figure 7.

Light micrograph of lung tissue from a rat exposed to quartz particles (5 mg/kg) at 1 month post-instillation exposure. This micrograph illustrates the terminal bronchiole (TB) and corresponding alveolar ducts (AD). Note the prominence of tissue thickening (arrows) at the junction at the terminal bronchiole and alveolar duct bifurcation. Magnification = ×100.
