
Fig. 8.
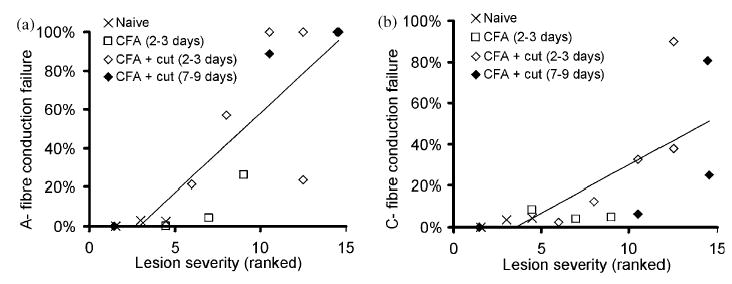
Relationship between lesion severity and A- and C-fibre conduction failure across the lesion site (Lowest rank=least damaged). The number of days post surgery is shown for each group. Trend lines have been fitted to all data points (rank correlation coefficient (r) for A-fibres=0.91, correlation coefficient (r) for C-fibres=0.87). Note that in a single CFA-treated animal with the sheath cut there was no A- or C-fibre conduction block and correspondingly this animal had one of the lowest rank values.