
Fig. 9.
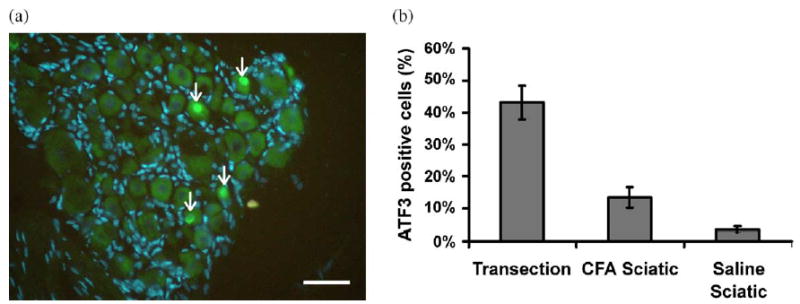
Immunofluorescence staining of DRG following CFA treatment of the sciatic nerve (a). The nuclei of DAPI positive neuronal cells appear as large circular pale blue structures compared to the smaller elongated brighter blue nuclei of the satellite cells; nuclei of ATF3 positive cells appear bright green (arrows). ATF3 and DAPI images were overlaid using Photoshop (Adobe, USA). ATF3 expression following CFA treatment was 15.3%. Scale bars=100 μm. (b) Summary of ATF3 expression following nerve transection (n=5), CFA treatment (n=6) and saline treatment (n=7). Error bars=SEM.