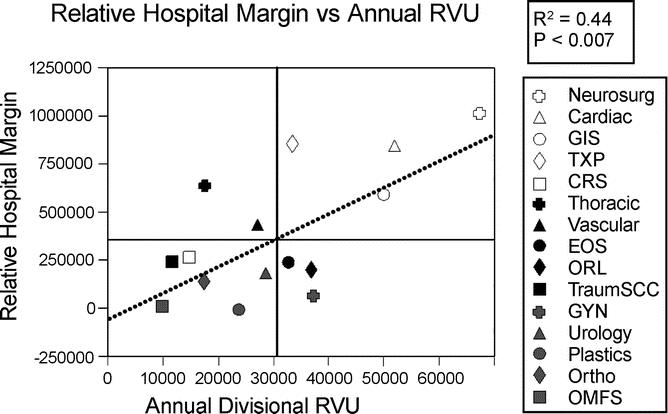
FIGURE 2. There is a significant positive correlation between relative hospital margin (RHM) (mu) and annual cumulative RVU for each surgical service, with R2 = 0.44 and P < 0.007. Quadrant boundaries reflect mean RHM and annual RVU for the clinical services, with mean RHM 381.238 mu and mean annual RVU 30,778. GIS, gastrointestinal surgery; TXP, liver, kidney, and pancreas transplant surgery; CRS, colorectal surgery; EOS, endocrine and oncologic surgery; ORL, otorhinolaryngology; TraumSCC, trauma and surgical critical care; GYN, gynecologic surgery; Ortho, orthopedic surgery department; OMFS, oral maxillofacial surgery department.
