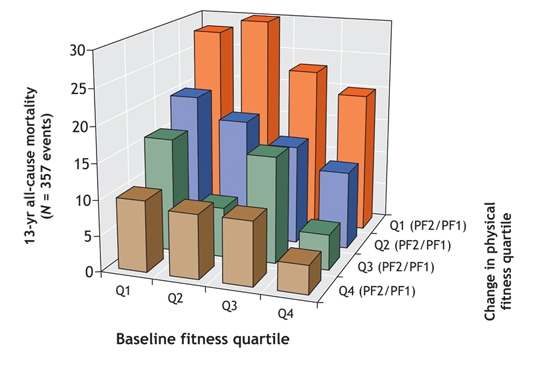
Fig. 2: Relation between changes in physical fitness and changes in mortality over time. Participants were evaluated at baseline (PF1) and again 13 years later (PF2). The ratio of PF2/PF1 × 100 was calculated to evaluate changes in physical fitness over the study period compared with fitness level at baseline. For this figure, participants were grouped according to fitness quartiles (Q1 = least fit, Q4 = most fit) for the baseline evaluation and to quartiles for change in fitness from baseline to 13-year follow-up (Q1 PF2/PF1 = least change, Q4 PF2/PF1 = most change). Adapted, with permission, from Erikssen et al35 (Lancet 1998;352:759-62).
