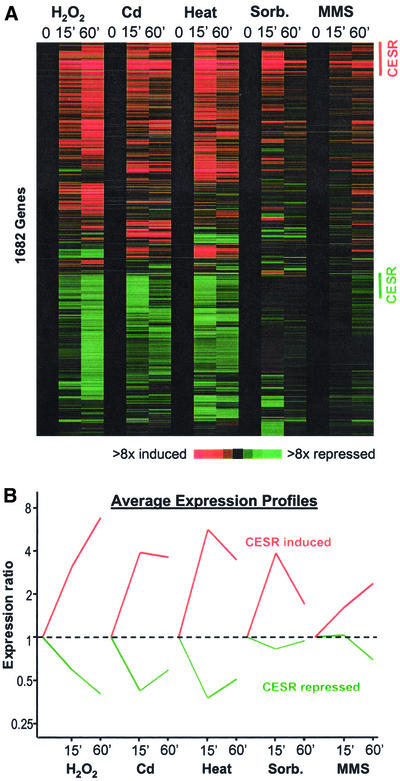
Figure 1.
Changes in gene expression in response to five environmental stresses. (A) Approximately seventeen hundred genes whose transcript levels changed significantly by at least twofold in one or more of the stress conditions were hierarchically clustered based on their expression patterns in the five time course experiments (Eisen et al., 1998; see “Materials and Methods”). Horizontal strips represent genes, and columns represent experimental time points. The fold changes in expression, relative to the untreated wild-type sample (time point 0), are color-coded as shown in the bar. The labels on the right indicate CESR induced genes (red; Table 1) and repressed genes (green) that were chosen based on conservative criteria as described in “Materials and Methods.” (B) Average expression patterns of the CESR-induced (red) and -repressed (green) genes as labeled in A in the five stress conditions.

