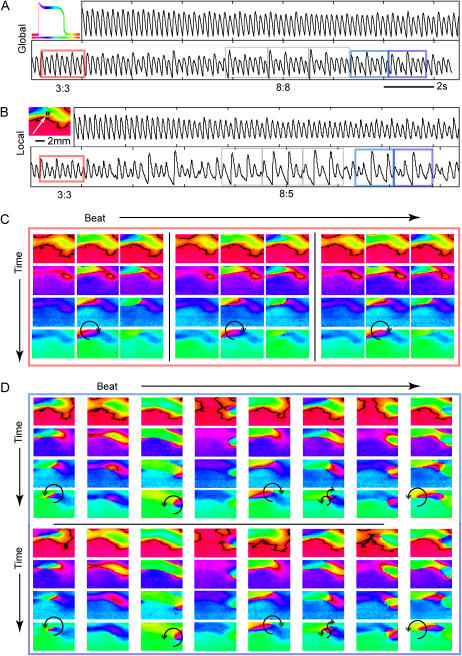
FIGURE 10.
Spatiotemporal instability patterns at breakpoint frequency. (A) Shown is the global (space-integrated) signal over an entire scaffold at 10-V/cm stimulation at breakpoint frequency. The image to the left explains how phase-related color encodes the relative temporal position along a transient with the color scale bar underneath a schematic transient. (B) Pseudo-PMT signal (mean intensity over PMT-equivalent area) taken from the region indicated with a white square. Gray boxes are used to illustrate the period of the arrhythmia: here a period 8 (8:8 rhythm) is observed on the macroscopic level. (C) Phase portraits during the time highlighted in red above demonstrate a period 3 spatiotemporal pattern. Each column represents an individual successive beat and each row shows the evolution during a beat (selected frames are 40 ms apart). (D) Selected beats and spatiotemporal patterns that have spontaneously evolved while maintaining the 5-Hz pacing. After ∼6 s, a period 8 pattern emerges (8:8 alternans in the global, and 8:5 block in the local signal), and after another three cycles the period 8 pattern shifts abruptly into a different period 8 pattern shown here in light and dark blue rectangles. Again, each column represents a successive beat and each row shows a frame 40 ms later than the previous row. The last four rows represent the next eight beats of the pattern in the same format as above. Sites of wavebreak-induced transient reentries are indicated by an arrow. See text for further details; movies are available as Supplementary Materials.

