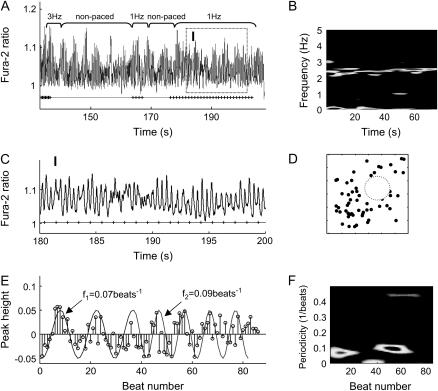
FIGURE 6.
VF-like signals with low-frequency modulation. (A) Cells exhibited irregular oscillation at ∼2.5 Hz as shown in (B) STFT on original recording. (C) Magnified version of zone I. (D) A central hollow structure was seen in the Poincaré map. (E) Stem plot of calcium peak-height values from zone I, with superimposed two simulated envelope curves at 0.07 beat−1 and 0.09 beat−1, indicating the existence of low-frequency modulations. (F) STFT on peak-height values confirms the time low-frequency modulations.

