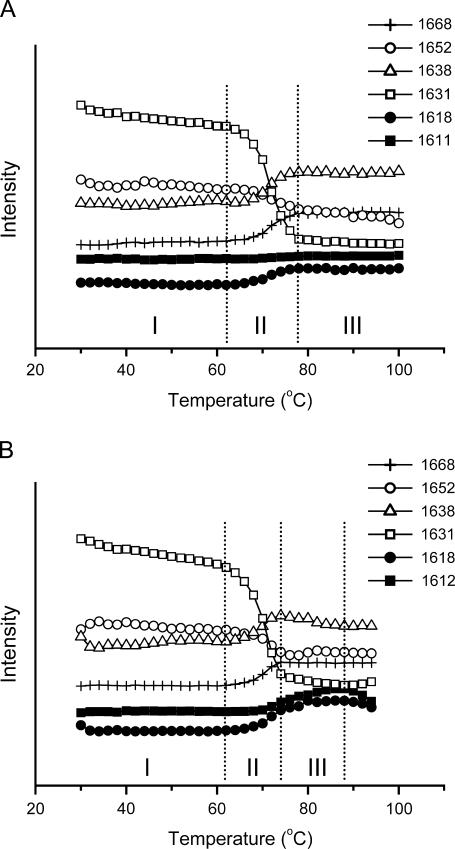
FIGURE 2.
Comparison of the conformational changes of RNase A thermal denaturation in acidic (A) and basic (B) conditions. The intensity of certain bands was obtained from the second derivative spectra using the quantitative second derivative infrared method (26). Periods I–III correspond to the “pretransitional stage”, “major unfolding stage”, and “residual unfolding stage” or “early aggregation stage”, respectively. All other conditions were the same as those in Fig. 1.

