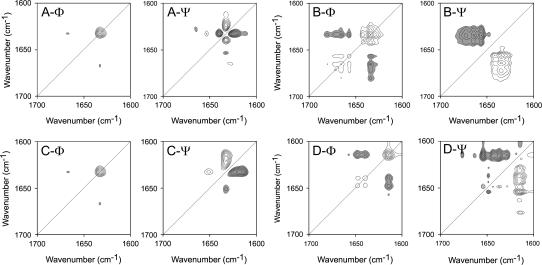
FIGURE 3.
2D correlation analysis of the IR spectra of RNase A thermal denaturation in acidic (A and B) and basic (C and D) conditions. Synchronous (Φ) and asynchronous (Ψ) plots were constructed from the corresponding spectra recorded in Period II (A and C) and III (B and D) defined in Fig. 2. Period II corresponds to the temperature range of 62–76°C (A, pD 6.0) or of 62–74°C (C, pD 8.0), whereas Period III corresponds to the temperature range of 78–100°C (B, pD 6.0) or 76–84°C (D, pD 8.0). Clear and dark peaks represent positive and negative, respectively.

