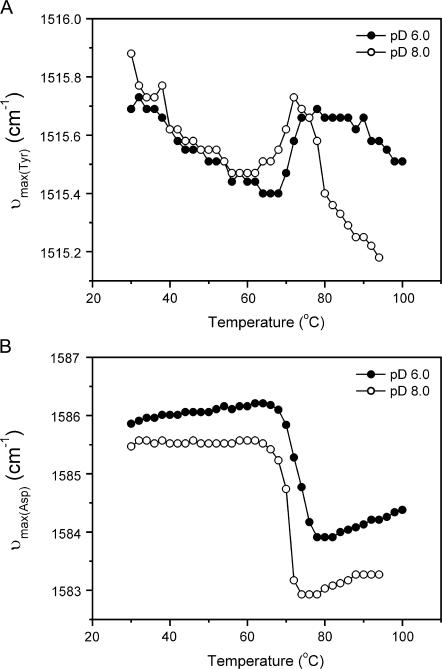
FIGURE 6.
Peak shift of the marker bands of Tyr (A) and Asp (B) side chains during RNase A thermal denaturation. The protein was tested in acidic conditions (•) or basic conditions (○) as a function of temperature. The maximum wavenumbers around 1515 and 1584 cm−1 were directly measured in the original spectra.

