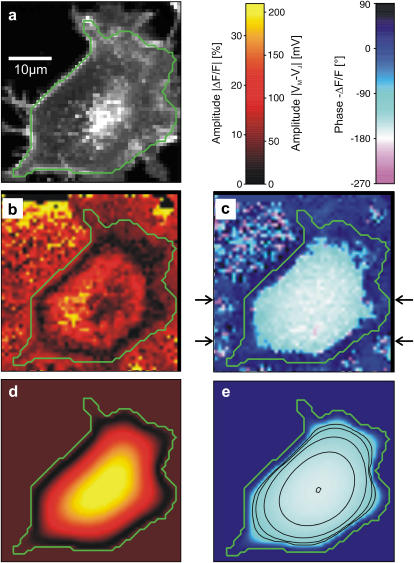
FIGURE 5.
Measurement of extracellular sheet resistance in cell adhesion. (a) Fluorescence micrograph of HEK293 cell on a silicon chip coated with fibronectin. The green line marks the periphery of cell adhesion. (b and c) Color-coded maps of amplitude and phase of the negative relative experimental fluorescence modulation  at a frequency
  . The arrows in c limit the region where the phase profiles are measured at various frequencies (see Fig. 6). (d and e) Computed maps of amplitude and phase of transmembrane voltage for a sheet resistance
  and a dye sensitivity
  .
.

