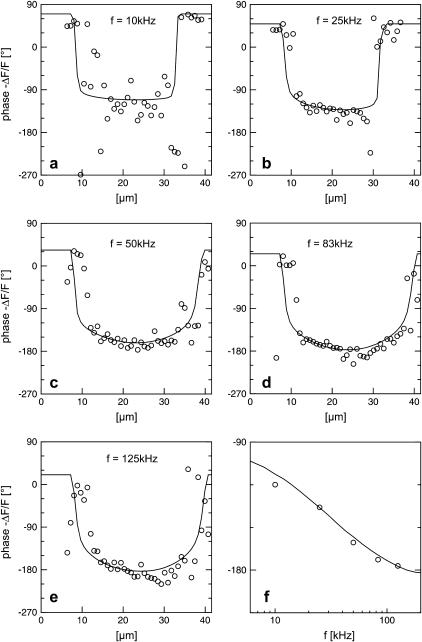
FIGURE 6.
Voltage transfer to HEK293 cell on fibronectin at five stimulation frequencies. (a–e) Phase profiles of the negative relative experimental fluorescence modulation  between the arrows in Fig. 5 c at 10, 25, 50, 83, and 125 kHz. The drawn lines are computed with a sheet resistance
  . The phase in the free membrane is marked by horizontal lines. (f) Experimental and computed phase versus frequency in the center of adhesion averaged over 9 μm.

