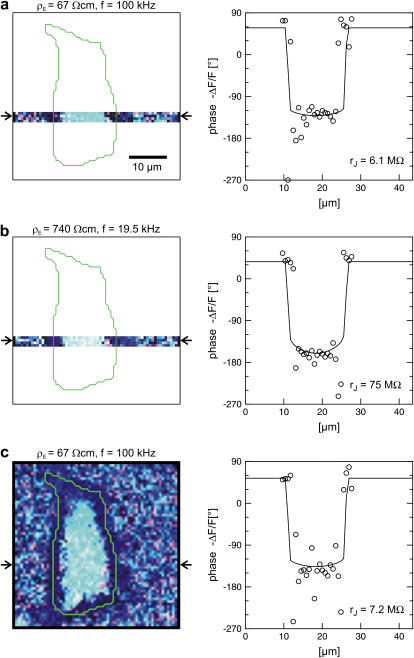
FIGURE 7.
Extracellular sheet resistance in cell adhesion for exchange of bulk electrolyte. (a, left) Color-coded phase map of negative relative change of fluorescence  for a narrow stripe of HEK293 cell on fibronectin in a bath electrolyte with a resistivity
  . The green line marks the periphery of cell adhesion. (a, right) Phase profile fitted with sheet resistance
  . (b, left) Phase map for narrow stripe at a bulk resistivity
  . (b, right) Phase profile fitted with
  . (c, left) Complete phase map after exchange of the bath back to a resistivity
  . (c, right) Phase profile fitted with
  . The frequencies are indicated in the figure. The color code is given in Fig. 5. The phase in the free membrane is marked by horizontal lines.

