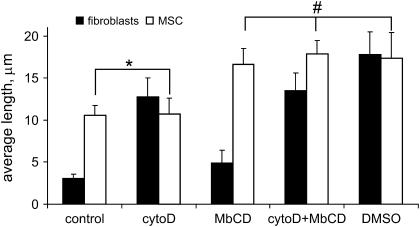
FIGURE 6.
Effect of different drug treatments on the average tether length in fibroblasts and hMSCs. For each type of cell, control case was significantly different (p < 0.01) from those treated with drugs. However, one exception is found in hMSCs before and after cytochalasin D treatment, where the tether length was not statistically different (marked with *). Also, no statistical difference was observed between tether length in hMSC exposed to MβCD, MβCD/CytoD, and DMSO (indicated by #). The value in each category represents the average and standard error of measurement from 35 to 40 tethers.

