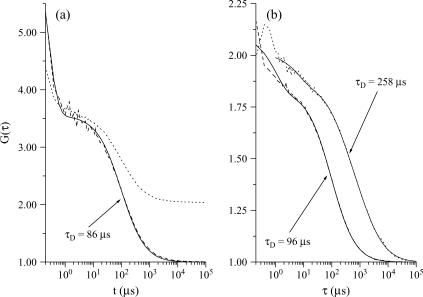
FIGURE 2.
Autocorrelation curves of eGFP fluorescence signals and their corresponding fits (solid lines), the diffusion times of which are given in the figure. Panel a corresponds to the data of the vesicle plotted in Fig. 1 b, before correction of the fluorescence decay (dotted line) and after correction (dashed line). Panel b shows a comparison between the autocorrelation obtained in solution (dashed line) and in a cell, after correction (dotted line). The amplitude of the autocorrelation function of eGFP in cell has been multiplied by a factor 20 for convenience; in addition, a slow component (τD = 1566 μs) had to be added to perform a satisfactory fit, up to very long times. In all cases the laser power is 13 μW.

