FIGURE 4.
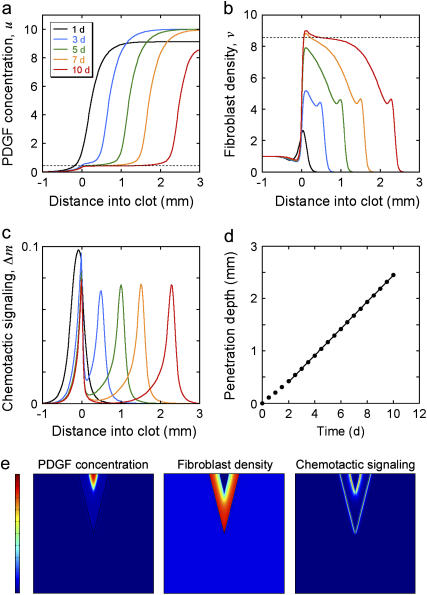
Progression of wound invasion. (a–d) Model calculations were performed assuming base-case parameters and a one-dimensional patch clot with thickness l = 3 mm. Profiles of PDGF concentration u ((a) dashed line, u = u† = 0.424), fibroblast density v ((b) dashed line: v = v† = 8.53), and chemotactic signaling Δm (c) at the indicated times in days are shown. (d) The fibroblast penetration depth, defined here as the maximum distance into the clot at which v = 0.5, increases linearly with time after a transient of ∼2 days. (e) Model calculations assuming a two-dimensional slash clot. The V-shaped clot has a depth of 10 mm and a width of 5 mm at the top; the dimensions of the tissue portion shown are 20 × 20 mm. Profiles of PDGF concentration (scale, 0–10), fibroblast density (scale, 0–10), and chemotactic signaling (scale, 0–0.1) are shown at t = 7 days. The magnitude of the latter incorporates both x- and y-components of the Δm vector, according to  .
.

