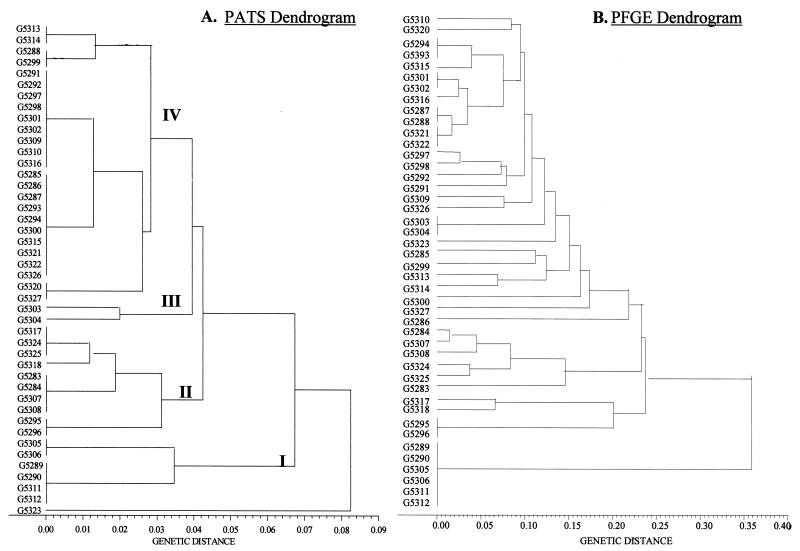
FIG. 2.
A phylogenetic analysis of O157 isolates with PATS and PFGE data. Dendrograms were constructed by the unweighted pair-group method with arithmetic means. PFGE gels were analyzed with Molecular Analyst Fingerprinting Plus software (Bio-Rad), and the data were exported as a band-matching table so that the two sets of data could be analyzed by the same method. (A) PATS dendrogram. The PATS profiles resolved the isolates into four major clusters. The genetic distance is indicated in increments of 0.01 below the dendrogram. (B) PFGE dendrogram. The PFGE profiles resolved the isolates into smaller clusters and showed greater genetic distances between the isolates.

