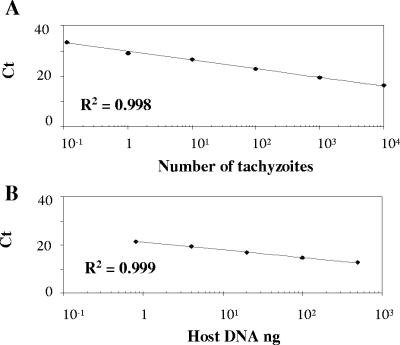
FIG. 2.
Standard curves for the quantification of the N. caninum Nc5 sequence and the 28S rRNA host gene. (A) N. caninum standard curve showing Ct values plotted versus the log of the initial 10-fold dilution series of parasite DNA equivalent to 10−1 to 104 tachyzoites. (B) 28S rRNA standard curve showing Ct values plotted versus the log of the initial fivefold dilution series of host DNA (500 to 0.8 ng). All points corresponding to the Ct values represent the mean of duplicate PCR amplifications.

