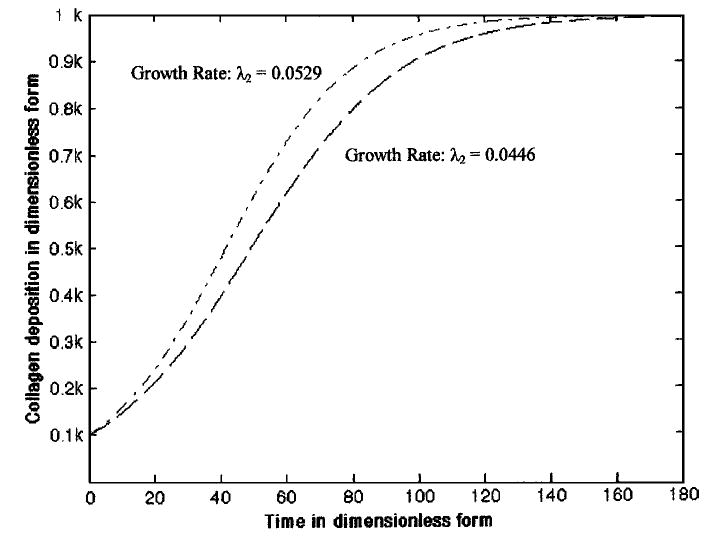
FIGURE 2.

Numerical solution of collagen deposition in an engineered cartilage construct (Model I Eq. 9). The bottom curve (dash line) has been obtained by approximating the growth rate λ2 = 0.0446 (estimated from the data reported by Ragan et al.29) and the top curve (dash–dot line) has been obtained by approximating λ2 = 0.0529 (estimated from the data reported by Wilson et al.36). Again, k is the carrying capacity of the collagen molecules in engineered cartilage constructs (noted as K2 in the text).
