
FIGURE 5.
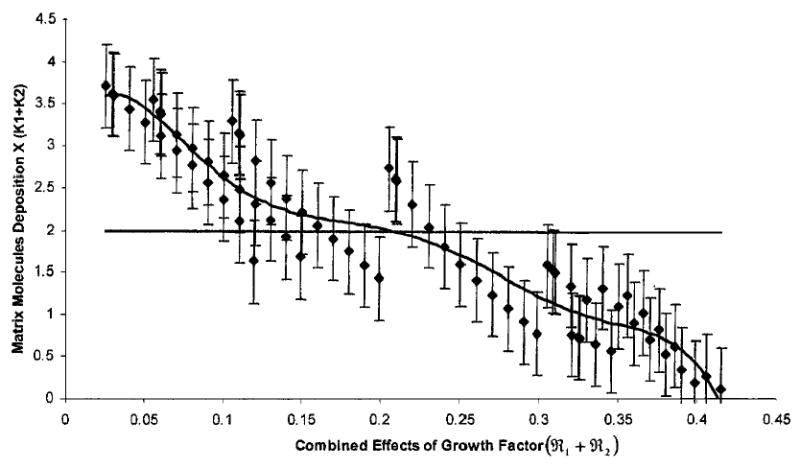
A plot demonstrating the simulated deposition of GAG plus collagen molecules in the steady state condition (τ → ∞) due to a perturbation in growth factors. The abscissa indicates the leve of growth factors (ℜ1 + ℜ2) and the ordinate represents the deposition of matrix molecules as a coefficient of the carrying capacities (K1 + K2). The solid horizontal line in the middle of the plot represents the total ECM accumulation where the variability of growth factor was not extended beyond that achieving a fixed, steady state condition (outcome of Model I). Data points are mean ECM accumulation (±5% of the combined probable distributions) for possible steady state conditions when made dependent upon different levels of additional growth factor (outcome of Model II). The curve represents the line of best fit. The model parameters were chosen from the experimental data of Table 1.36