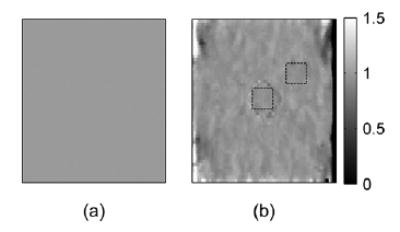
Fig. 13.

(a) Ideal Poisson’s ratio image (uniform value of 1) and (b) estimated Poisson’s ratio image with ROI’s (square boxes) for calculating the means and standard deviations of the Poisson’s ratio inside and outside the inclusion, respectively. The means inside and outside are 0.9578 and 0.9587, respectively. The standard deviations inside and outside are 0.0411 and 0.0294, respectively.
