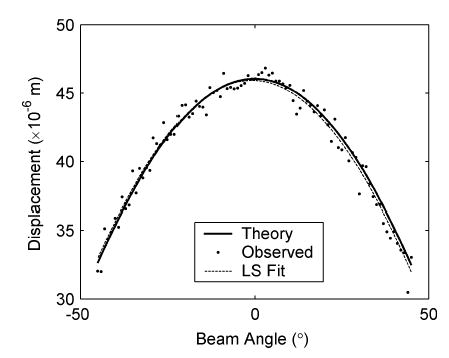
Fig. 7.

Plot of displacement at a 1-cm depth for the center A-line of the inclusion phantom versus insonification beam angle. Shown are projections of the actual displacement vector onto the unit vector, calculated using dθ = 0.0460 cosθ (solid line); the displacement observed using different insonification angles (dots), and the projection of the displacement vector estimated using the least squares fit:dθ(fit) = 0.0459 cosθ − 7 × 10⁻⁴ sinθ (dotted line). Note that the actual displacement is 0.0460 and 0 mm in the z and x directions, respectively, while the corresponding estimated displacements are 0.0459 mm (z) and −7 × 10⁻⁴ mm (x).
