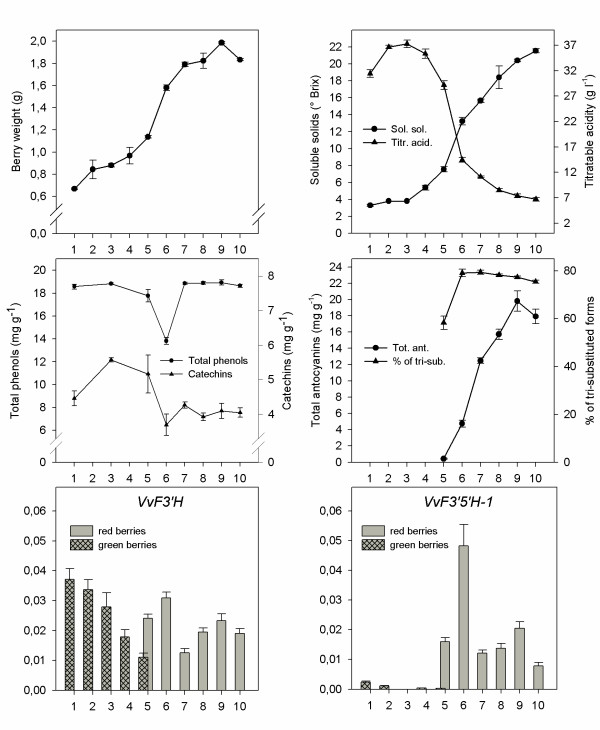
Figure 9.
Transcript profiling of VvF3'H and VvF3'5'H-1 in ripening berries. Ripening curve of V. vinifera 'Merlot' was based on analytical parameters (berry weight, soluble solids, titratable acidity expressed as tartaric acid equivalents, skin total phenols expressed as (+)-gallic acid, skin catechins expressed as (+)-catechin, skin anthocyanins) at the following sampling dates: 1. July 15th, 2. July 29th, 3. August 3rd, 4. August 9th, 5. August 12th, 6. August 24th, 7. September 3rd, 8. September 13th, 9. September 20th, 10. September 28th. Concomitant gene expression of VvF3'H-1 and VvF3'5'H-1 in berry skin was assessed by quantitative RT-PCR and expressed as the ratio between the CT of the gene under study and the CT of the actin gene. Bars represent ± s.e..

