
Figure 6.
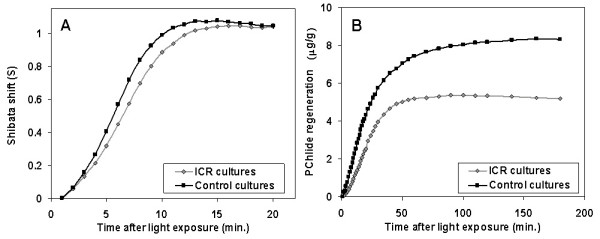
Shibata shift and PChlide650 regeneration. Left: The Shibata shift indicates the degree of spectral shift from 684 to 672 nm as a normalized function (see eq. (1)). This process seems to be slightly delayed for plants etiolated grown at the Ca2+ ICR (rhomb dotted line) at BDC = 65 μT, f(BAC) = 50 Hz, with respect to those of controls (square dotted line) grown under the same conditions but in the absence of an EMF. Right: The regeneration of PChlide650 is calculated by eq. (3) The plants grown at the Ca2+ ICR (rhomb dotted line) have probably a lower activity as controls (square dotted line) grown under the same conditions but in the absence of an EMF.