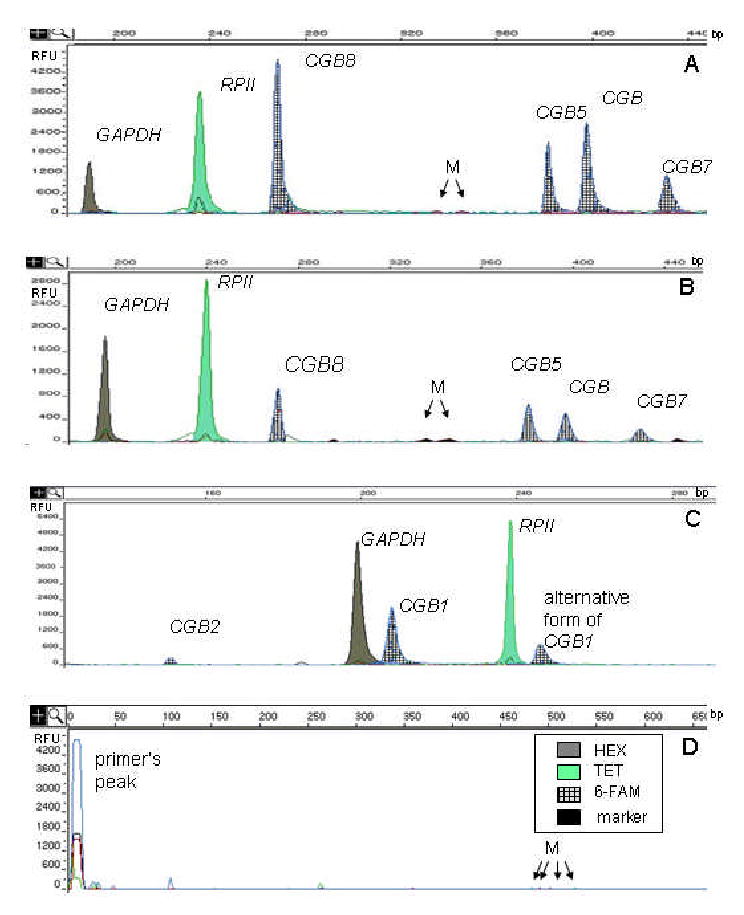
Figure 2.

GeneScan electrophoretograms showing the amplified fluorescent-labeled (6-FAM, HEX or TET) products of reference genes and CGB genes after treatment by restriction enzymes. The x-axis shows the size of the detected fragments in base pairs (bp), and the y-axis represents the relative intensity of fluorescence (RFU). M, marks the peaks of the GeneScan-500 TAMRA internal size standard. The large peaks indicate the DNA fragments: glyceraldehyde-3-phosphate dehydrogenase (GAPDH) at 196bp, RNA polymerase II largest subunit (RP II) at 239bp, CGB8 at 273bp, CGB5 at 380bp, CGB at 401bp, CGB 7 at 433bp, CGB1 at 207bp, CGB2 at 144bp, and alternatively spliced CGB1 at 254bp.
A, The expression pattern of hCG beta subunit determining genes in placenta from III trimester (41weeks) of normal pregnancy: CGB8>>CGB>CGB5>CGB7. B, The trophoblastic tissue from ectopic pregnancy (6weeks) expresses the genes: CGB8>CGB5>CGB>CGB7. C, The trophoblastic tissue from ectopic pregnancy (7 weeks) expresses CGB1, CGB2, and alternatively spliced CGB1. D, Negative control.
