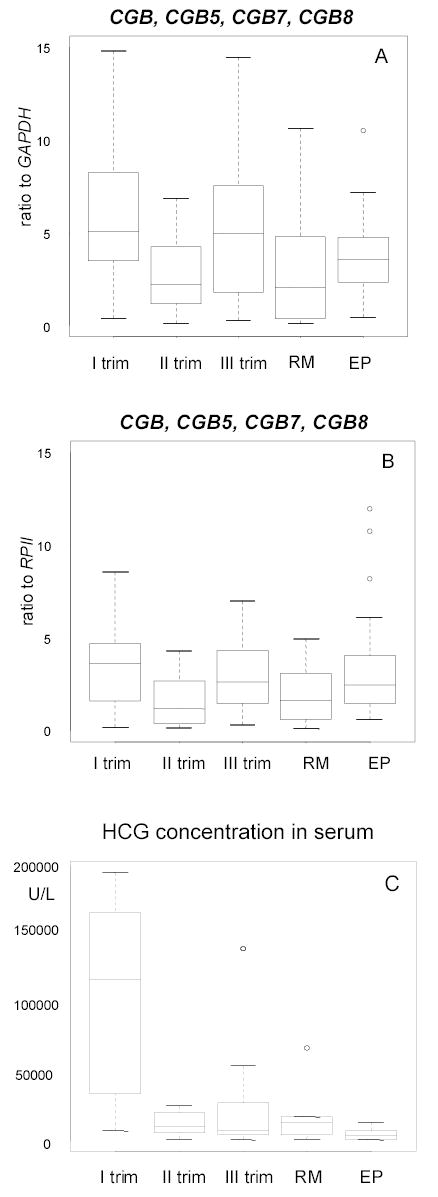
Figure 3.

Notched boxplot for the distribution of the summarized expression level of hCG beta subunit mRNAs from CGB, CGB5, CGB7 and CGB8 in placenta during the first, second and trimester of normal pregnancy, in case of recurrent miscarriage (RM) and ectopic pregnancy (EP). The boxes represent the 25th and 75th percentiles. The median is denoted as the line that bisects the boxes. The whiskers are lines extending from each end of the box covering the extent of the data on 1.5 X interquartile range. Circles represent the outlier values.
A, Results in relative to reference gene GAPDH.
B, Results in relative to reference gene RPII. A strong correlation (r=0.6, p<0.001) was found between A and B.
C, hCG concentration in the serum (U/L) measured on the day of tissue sampling in same groups is shown. The level of hCG during the first trimester of normal pregnancy is significally higher compared to recurrent miscarriage and ectopic pregnancy (p<0.005).
