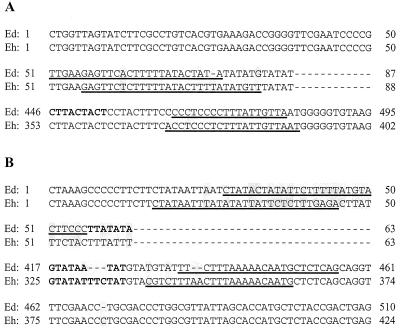
FIG. 5.
Alignment of nucleotide sequences from E. histolytica strain HM-1:IMSS (Eh) and E. dispar strain SAW760 (Ed). Only the repeat-flanking region sequences are shown. Nucleotides belonging to a repeat unit are in boldface. Single base differences are highlighted. Dashes indicate gaps introduced to optimize alignment. (A) Alignment at locus 1-2. Underlined regions show locations of the two pairs of 5′ and 3′ species-specific primer sequences (Dsp1 and Hsp1 and Dsp2 and Hsp2) which were used for PCR amplification. (B) Alignment at locus 5-6. Underlined regions show locations of the two pairs of 5′ and 3′ species-specific primer sequences (Dsp5 and Hsp5 and Dsp6 and Hsp6) which were used for PCR amplification.

