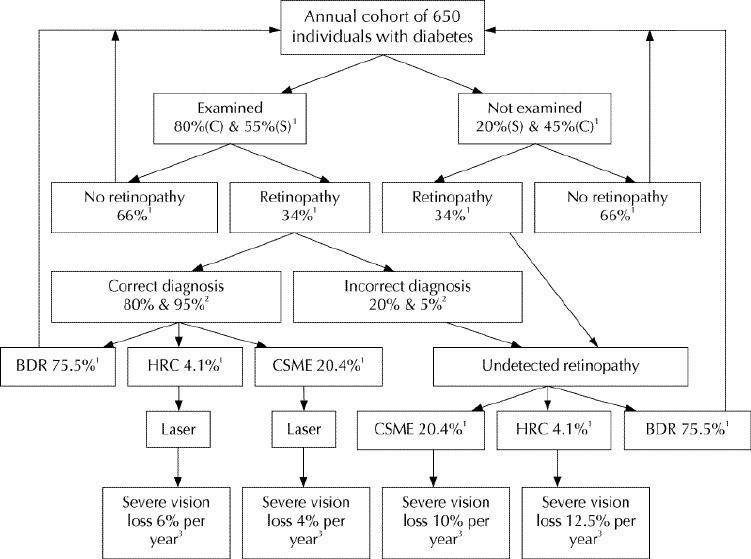
Fig. 2: Representative flow chart for evaluating visual outcomes of screening for diabetic retinopathy in programs based on visits by retina specialists (S) or the use of a portable retinal camera (C). Superscript 1 indicates data from the diabetic retinopathy screening program in western James Bay, in northern Ontario, for 145 consecutive Cree individuals with diabetes, of whom 25.5% had background diabetic retinopathy (BDR), 1.4% high-risk characteristics (HRC) for severe vision loss (equivalent to proliferative diabetic retinopathy with certain clinical criteria) and 6.9% CSME; these data are the best cross-sectional information available for the Cree population in 1997–1998. Superscript 2 indicates data from observational studies comparing modes of ophthalmic assessment for diabetic retinopathy.21,22,23,24,25,26,27,28,29,30,31 Superscript 3 indicates data from multicentre prospective randomized clinical trials on the effect of laser treatment on vision loss. Severe vision loss = 20/800.7,8
