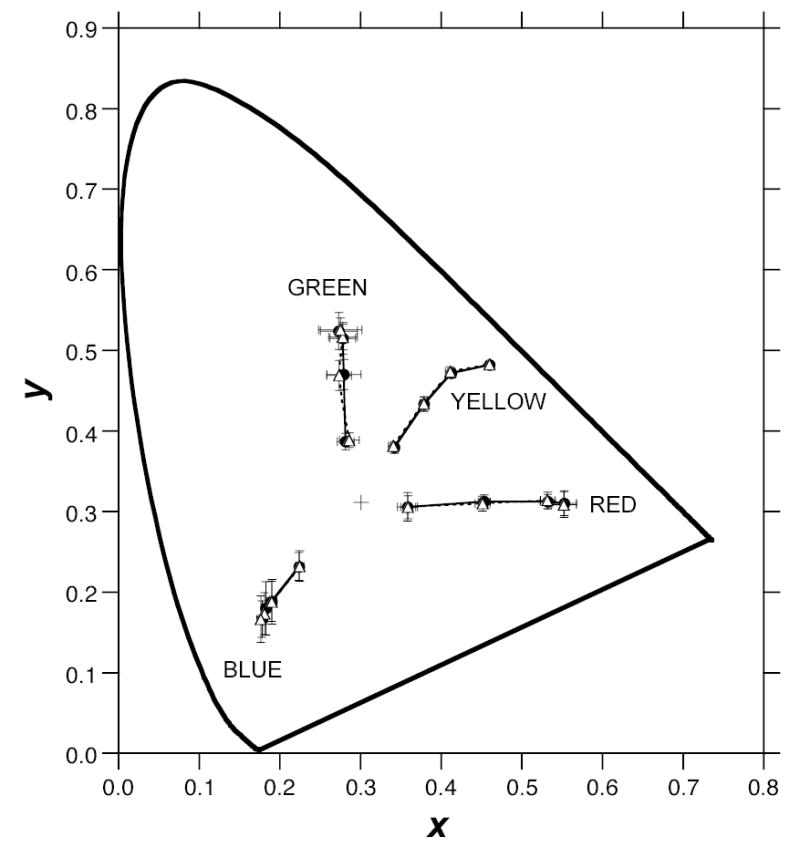
Figure 1.

The CIE chromaticity coordinates of mean focal color loci and mean unique hue loci. The error bars indicate standard deviations. The solid circles connected with the solid line are focal color loci. The open triangles connected with the dotted line are unique hue loci. The cross indicates the coordinates of the white paper surface used in the survey.
