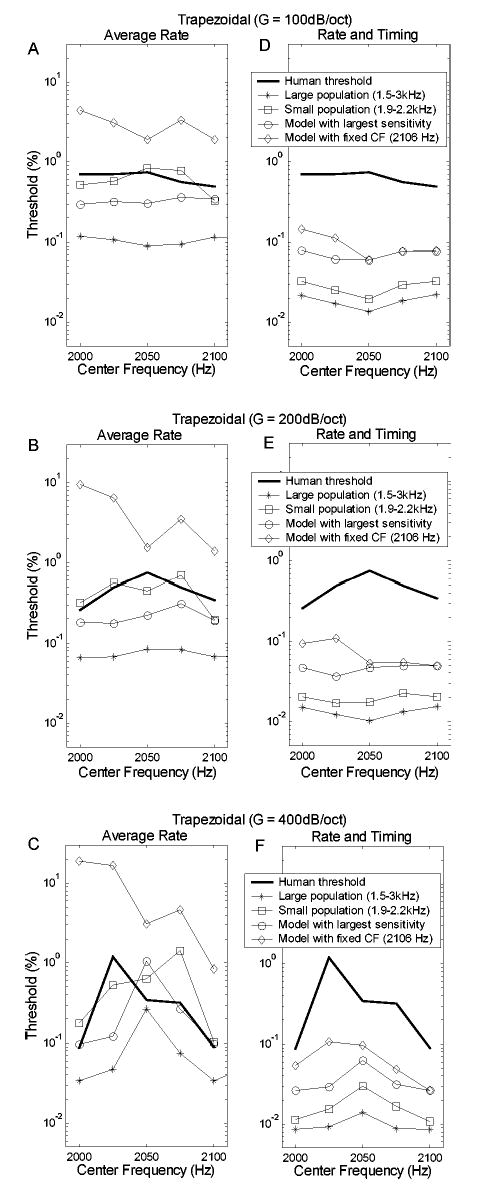
FIG. 10.

Thresholds for the trapezoidal spectra based on average rate information only (a)–(c) and based on both rate and timing information (d)–(f). Each row corresponds to spectral envelopes with a given slope (G=100, 200, and 400 dB/oct from top to bottom). The thick solid lines illustrate human thresholds. Different symbols distinguish the model predictions with different selections of model CF range.
