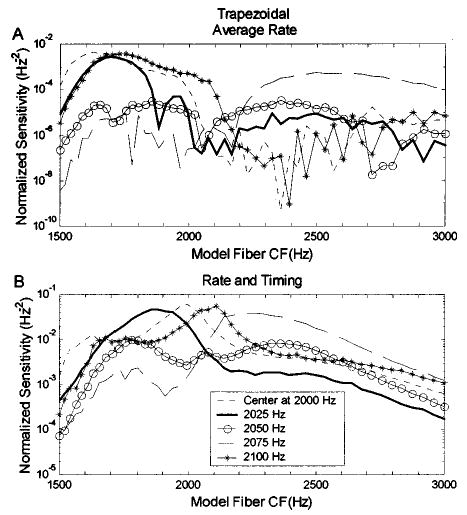
FIG. 11.

Sensitivity patterns as a function of model-fiber CF for the trapezoidal spectra with a spectral slope of 400 dB/oct. (a) Sensitivity based on only average-rate information and (b) based on both rate and timing information. Different harmonic-complex center frequencies are distinguished by different symbols. This figure illustrates how the information used by the model to discriminate changes in center frequency of stimuli with trapezoidal spectra is distributed across fibers tuned to different frequencies. As was true for triangular spectra (Fig. 8), the differences between the rate and rate-and-timing based models is largest for fibers with CFs near the center frequency of the stimulus spectrum.
