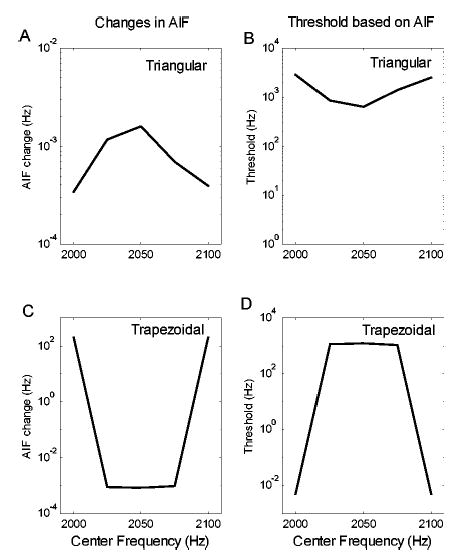
FIG. 13.

Predictions of center-frequency discrimination results for the triangular spectrum (a), (b) and the trapezoidal spectrum (c), (d) with G=400 dB/oct based on the unweighted averaged instantaneous frequency (AIF). The left column (a), (c) shows ΔAIF as a function of center frequency. The right column (b), (d) shows the reciprocal of ΔAIF as a function of the center frequency (solid line) and human thresholds (dashed line).
