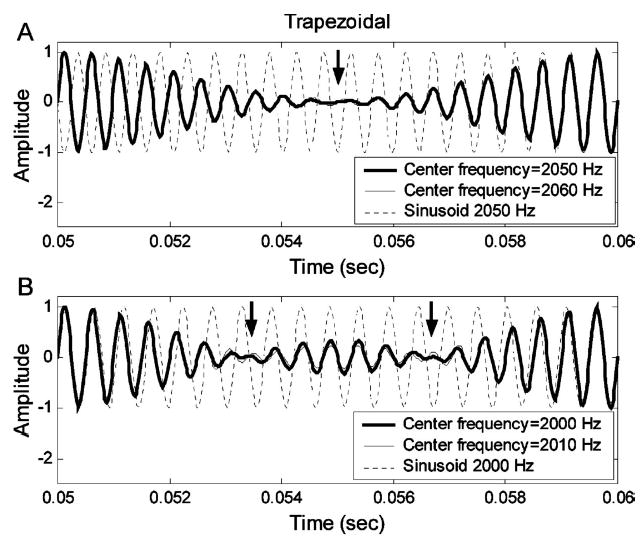
FIG. 5.

Time-domain waveforms for the simplified harmonic-complex signals with trapezoidal spectra. (a) Stimulus with center frequency of 2050 Hz; (b) stimulus with center frequency of 2000 Hz. In each panel, the thick solid line illustrates a signal without the center-frequency shift and the thin solid line illustrates a signal with a 10-Hz center-frequency shift. The dotted lines are reference sinusoidal signals of 2050 Hz (a) and 2000 Hz (b).
