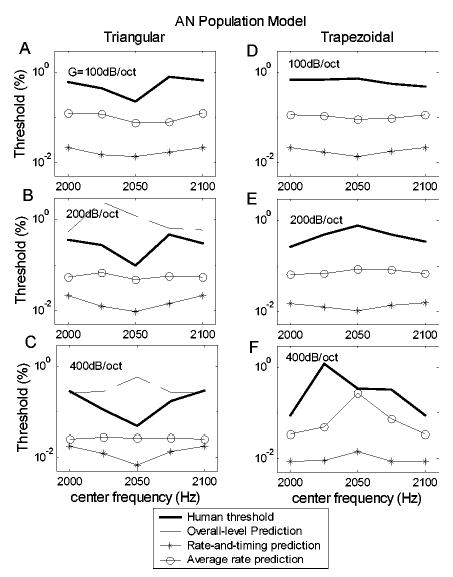
FIG. 6.

Thresholds of the AN population model for discrimination of the center frequency of harmonic-complex signals with triangular spectra (a), (b), (c) and trapezoidal spectra (d), (e), (f). Each panel corresponds to one slope of the spectrum envelope (G=100, 200, and 400 dB/oct from top to bottom). The lines with circles are predictions based on only average-rate information of the AN population responses. The lines with asterisks are predictions based on both rate and temporal information. The dashed lines (b), (c) are threshold predictions based on the change in the overall level of the stimuli with triangular spectra; these predictions clearly have incorrect trends in threshold as a function of center frequency as compared to the psychophysical results (Lyzenga and Horst, 1995). The predictions for triangular spectra based on the combination of rate and timing information (asterisks) showed the desired trends (i.e., lowest thresholds for center frequencies between harmonics) for all three spectral slopes.
