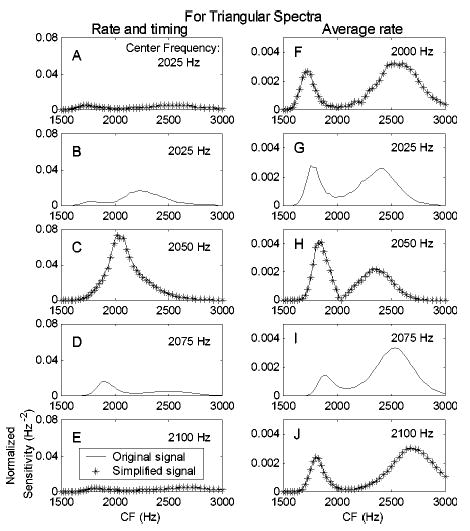
FIG. 7.

Sensitivity of model fibers to the changes of the triangular harmonic-complex center frequency as a function of model fiber CF. The left column (a)–(e) shows predictions based on rate information; the right column (f)–(j) shows predictions based on both rate and timing information. Each row corresponds to one harmonic-complex center frequency (2000 to 2100 Hz with a step size of 25 Hz). The lines are based on the original stimuli (for all center frequencies) and the asterisks are based on the simplified signals (shown for 2000, 2050, and 2100 Hz only).
