
Fig. 2.
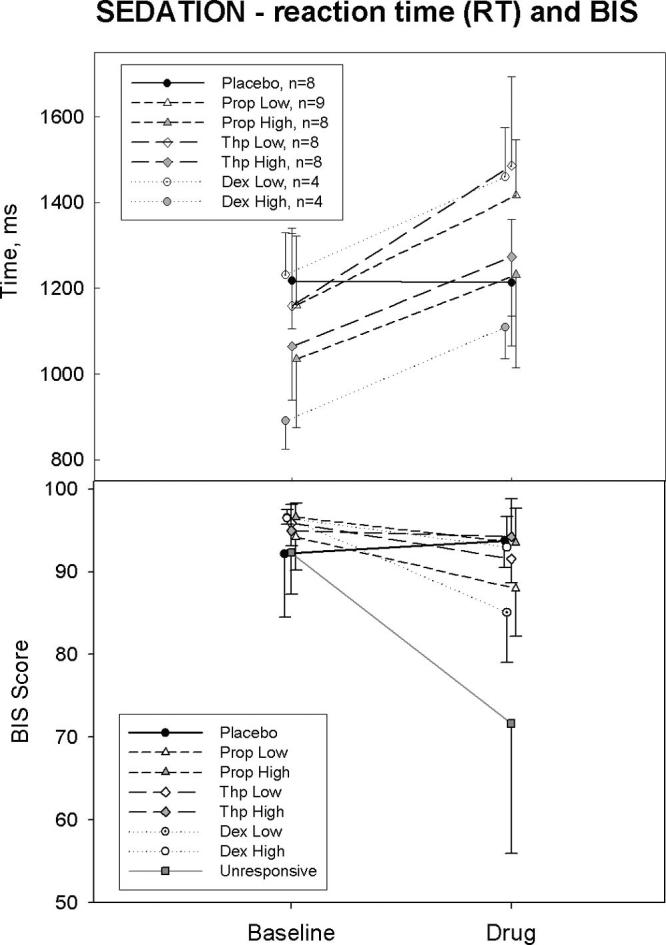
Sedation effect as measured by reaction time (RT, top) and Bispectral Index (BIS, bottom). Low-performing subjects (those with low lag10 performance scores during drug administration, gray symbols) demonstrated a greater sedative effect in comparison with high-performing subjects (open symbols) during drug administration. Unresponsive subjects had significantly lower BIS scores and are not included in data analyses. In this and other graphs, error bars represent SDs.