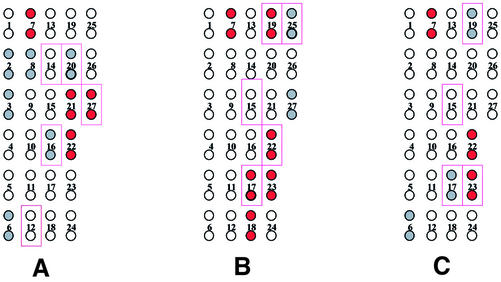
Figure 3.
Color-coded representation of hybridization results in region A of the 16S rRNA gene for three test species. (A) Pseudomonas aeruginosa, (B) P.fluorescens and (C) P.putida. Red-filled circles represent strong experimental hybridization signals (average pixel intensity 10 000–50 000). Gray-filled circles represent weak experimental hybridization signals (average pixel intensity <10 000). Open circles represent absence of detectable hybridization signal (average pixel intensity <1000). Solid rectangular outlines represent positions of predicted hybridization based on the existence of a single perfect match within the target.

