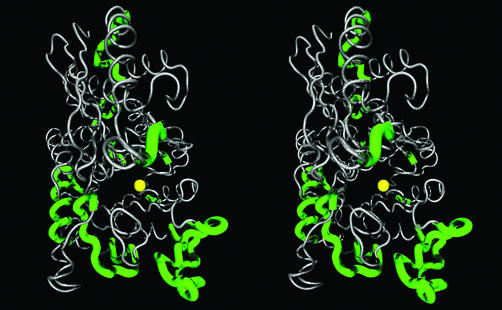
Figure 2.
Stereogram of gapped regions in the alignment of sequences of eukaryotic enolase versus sequences of MLE (MLE/cMLE) mapped on Hydra vulgaris enolase structure (1PDZ). The green/bold segments of backbone represent the gapped regions or segments of ambiguous homology between the two datasets. The Mn++ ion is represented by a yellow sphere and shown for reference.

