
Figure 4.
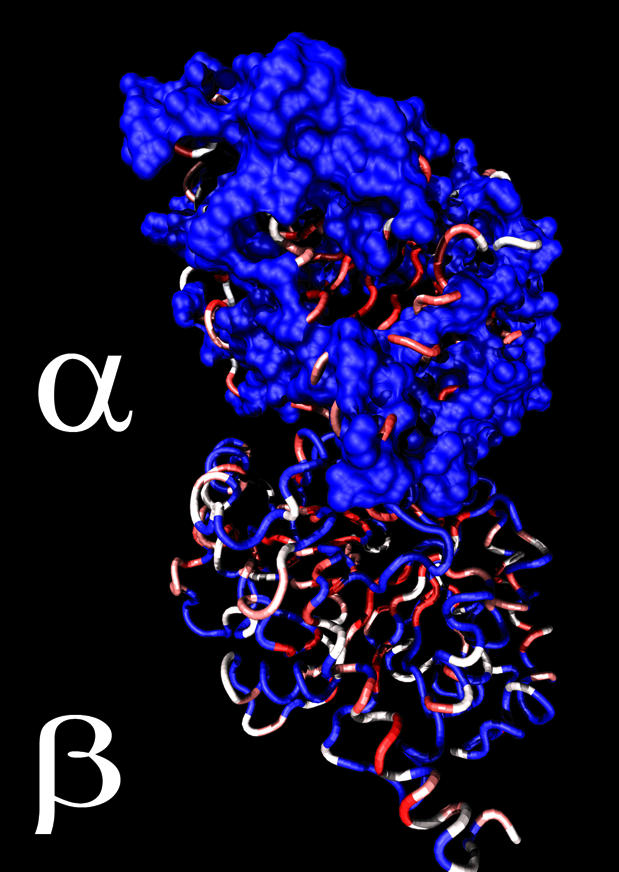
Site-rate map of the α- and β-tubulin heterodimer. The site rates are color coded from slow (blue) to fast (red) evolving on the dimeric bovine tubulin structure. The sites assigned to the slowest rate category were rendered as a molecular surface to demonstrate that the slow evolving sites are found at the surface of the protein.