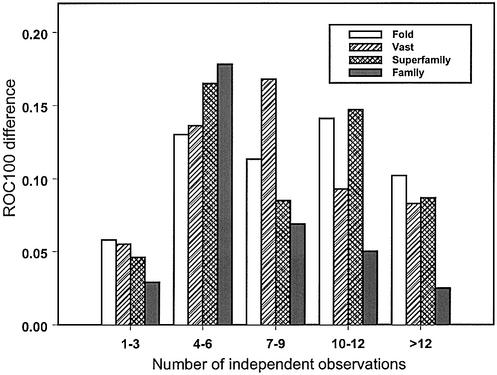
Figure 2.
Difference in recognition of VAST structure neighbors or SCOP fold/superfamily/family categories between sequence–profile and profile– profile alignment methods is plotted against the diversity of the test profile. Diversity is measured as the average number of independent observations (average number of different amino acid types per column of the alignment). Improvement in recognition is calculated as the average difference in ROC100 statistics between the profile–profile alignment method with scorefunction 2 and the sequence–profile alignment method.

