
Figure 4.
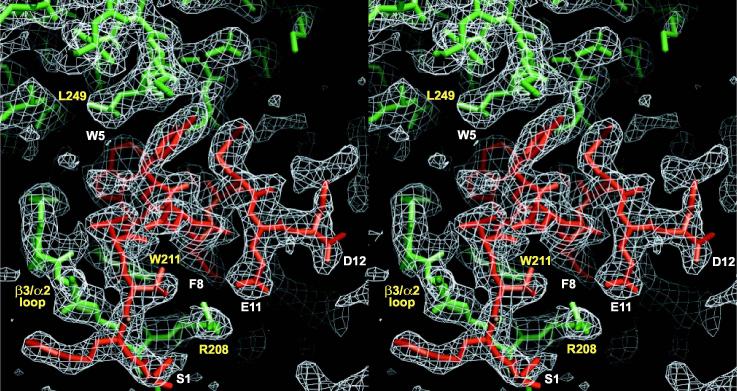
Stereoview of experimental electron density for the KB-752 peptide bound to Gαi1. The region highlighted is the entire peptide density (model in red; labels in white) found between switch II (α2 helix) and the α3 helix of Gαi1 (model in green; labels in yellow). Shown is a 2Fo-Fc simulated annealing composite omit map (generated with 5% overall model omitted) contoured at 1 s with electron density shown in white cage.