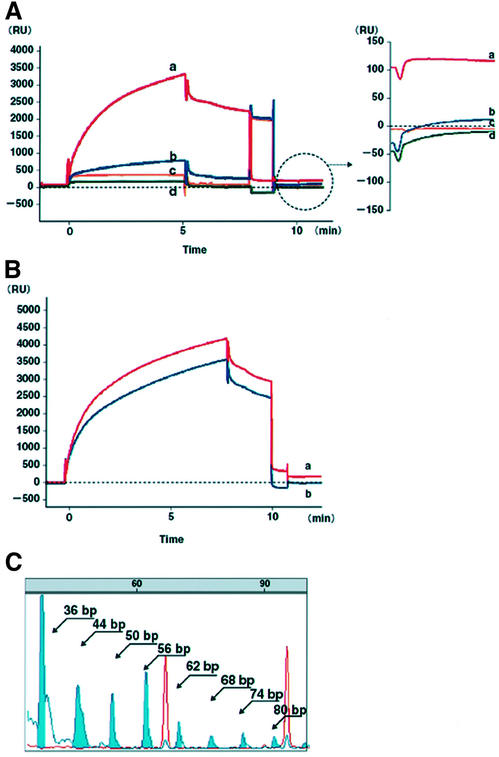
Figure 2.
Sensorgrams of the TRE assay, and an electropherogram of 6-bp ladders amplified from recovered TS-5′B oligomers from the sensor chip surface. (A) The TRE assays on SW480 (red line, E-value 118 RU). Bound protein was seen in the sample diluted in the TRE buffer without dNTP, in which a slight elongation of the oligomers was observed (blue line, E-value 12 RU). The heat-inactivated telomerase extract control did not bind to the TS-5′B oligomers, and exhibited no significant increase of E-value above the baseline level (yellow line, –1.2 RU). No difference was observed between the initial baseline and that after the regeneration phase in the TRE assay without telomerase extracts (green line, E-value –4 RU). (B) The TRE assay using oligomers biotinylated at the 5′-biotinylated (TS-5′B; red line) and 3′-biotinylated (TS-3′B; blue line) in SW480. Extracts bound to TS-3′B but did not elongate them because of the immobilized 3′ end on the sensor chip. (C) Six-base pair ladders were detected as blue peaks from 44 to 80 bp. Red peaks represent size markers (TAMURA 500, ABI).

