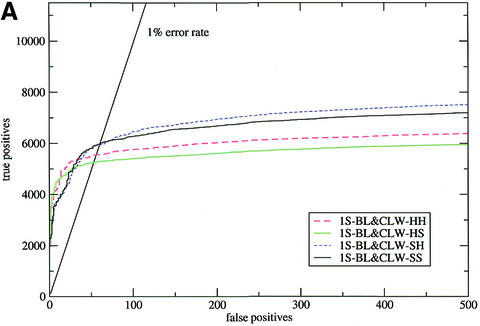
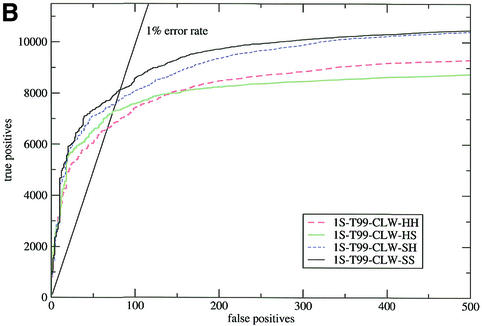
Figure 1.
Sensitivity plots for the SCOP all-against-all (test 2). The input alignments were: (A) the results of a WU-BLAST search of nrdb90 aligned with ClustalW; (B) T99 alignments realigned with ClustalW. In both figures, HH and SS are the default procedures for HMMER and SAM, respectively, HS indicates a HMMER model converted to the SAM format and scored by SAM, and vice versa for SH.


