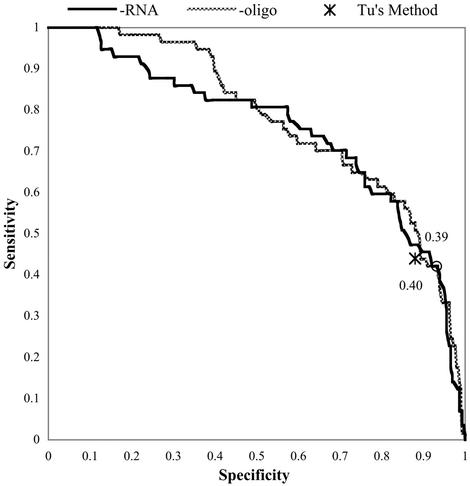
Figure 1.
ROC curves for a standard Chi-40 network tested using minus-one-oligo cross-validation and minus-one-RNA cross-validation. The circles indicate the points at which the networks scored their peak Matthews correlation coefficients (in this chart the circles are superimposed), the values of which are listed. Also shown for reference is the single point representing the sensitivity and specificity of Tu’s method (15) applied to predict the activities of oligos in the database.

