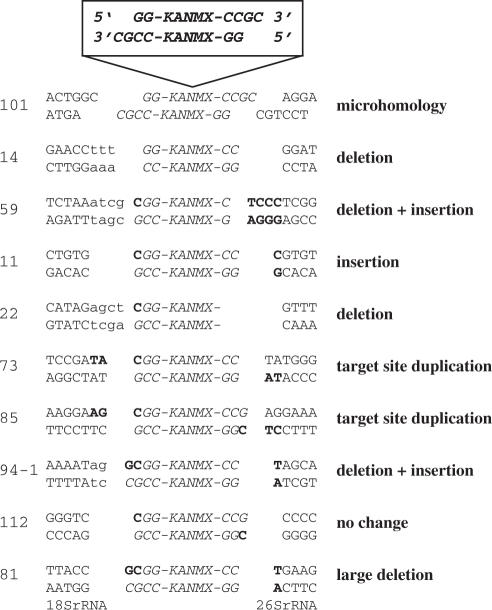
Figure 3.
Sequence analyses of genomic IR target sites. Plasmid pFA6a-KANMX was linearized with SacII resulting in 3′ overhangs (top). The type of alteration of the target site is indicated on the right. Insertions and deletions at the genomic target site or at the SacII restriction end are indicated with boldface and small letters, respectively. Integration by microhomology was only found in integrant 101. A deletion of more than 100 bp was observed for integrant 81, where the flanking sequences were homologous to 18S rDNA and 26S rDNA, respectively. The most common sequence alterations were small deletions or insertions as seen in integrant 14, 59, 11, 22, 73, 85 and 94-1. The numbers for each insertion are given according to their order of preparation during the plasmid rescue experiment.

