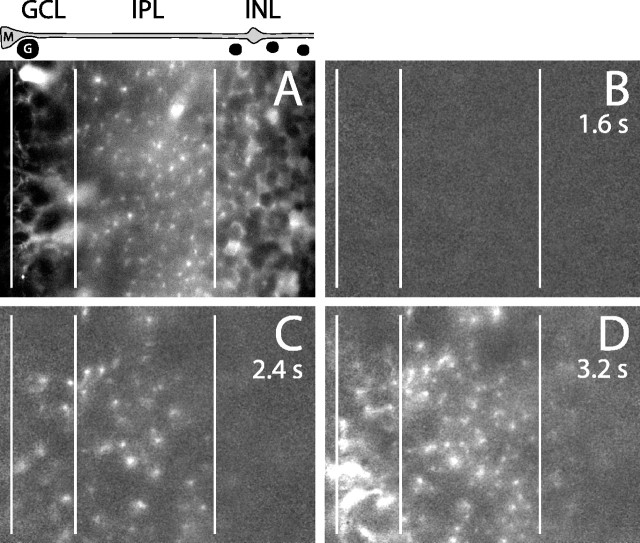
Figure 7.
Light-evoked Müller cell Ca2+ increases within different retinal layers (5 μm NECA in superfusate). The images are from an oblique optical section through an everted eyecup and show retinal layers within the inner half of the retina. The vertical lines indicate boundaries between retinal layers. INL, Inner nuclear layer. The drawing above A shows the location of a Müller cell (M), a ganglion cell soma (G), and neuronal somata within the INL (unlabeled). A, Ca2+ fluorescence image in the unstimulated retina. Müller cells are selectively labeled. Müller cell processes surrounding ganglion cell somata in the GCL, Müller cell stalk processes in the IPL, and Müller cell processes surrounding neuronal somata in the INL are shown. B-D, Ca2+ fluorescence ratio images showing the change in Ca2+ after light ON. At 1.6 s after light ON (B), no increase in Ca2+ is seen. At 2.4 s (C), Ca2+ rises in Müller cell processes within the inner and middle IPL and, to a lesser extent, in the GCL. At 3.2 s (D), Müller cell Ca2+ increases have spread throughout the GCL and into Müller cell endfeet at the inner retinal surface (far left). Müller cell Ca2+ increases also spread throughout the IPL and into the inner portion of the INL.

