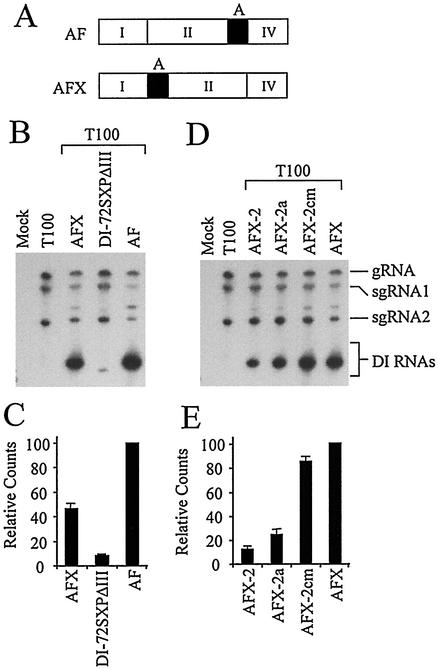
FIG. 11.
Effect of segment A translocation on DI RNA accumulation. (A) Schematic diagram depicting segment A (solid black rectangle) location relative to regions I, II, and IV (white rectangles) as labeled in AF and AFX DI RNA. (B) Northern blot analysis of mutant AFX. (D) Northern blot analysis of compensatory mutants AFX-2, AF-2a, and AF-2cm (see text for details on the structure of mutants). (C and E) Graphic representation of the DI RNA accumulation levels in panels B and D, respectively.

