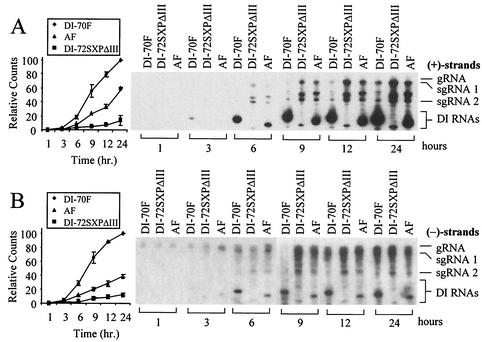
FIG. 6.
Time course analysis of accumulation of DI RNAs in protoplasts. (A) Northern blot analysis of plus strand accumulation of DI-70F, AF, and DI-72SXPΔIII in cucumber protoplasts at 1, 3, 6, 9, 12, and 24 h postinoculation as described in the legend to Fig. 5B. Graph depicts quantification of DI RNA accumulation levels by radioanalytical scanning. (B) Corresponding minus strand analysis.

