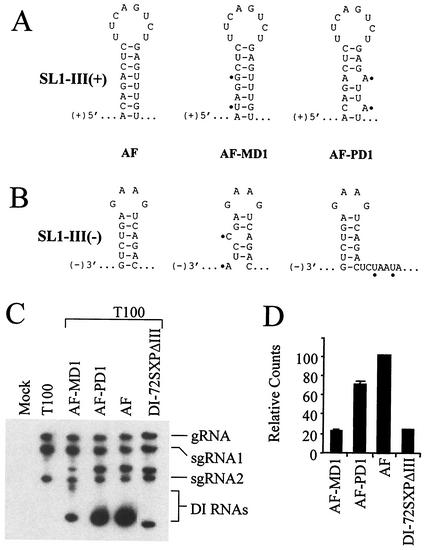
FIG. 8.
Analysis of AF mutants with targeted disruptions in SL1-III(+) and SL1-III(−). Diagrams depict nucleotide substitutions (indicated with black dots) and their effect on SL1-III(+) (A) and/or SL1-III(−) (B) secondary structures, as predicted by mfold. (C) Northern blot analyses of DI RNA accumulation in protoplasts. (D) Graphic representation of the DI RNA accumulation levels in panel C.

